Experience
modelizeIT is a proven technology that is trusted by partners, enterprises, and governmental organizations.This includes 19 clients from the Fortune-100 list.
Our system was used to collect the data from 700,000+ servers since 2012.
Application models
modelizeIT offers by far the largest set of application models for the analysis of software configurations and application architecture.- Thousands of software product models
(ranging from IT to industry-specific applications such as banking, manufacturing, gaming, etc.) - 700+ software vendors
- 75 web and application server frameworks
- 47 database engines
- 30 messaging middleware systems
- 14 virtualization technologies
- 12 OS clustering technologies
- 7 application-level load balancers
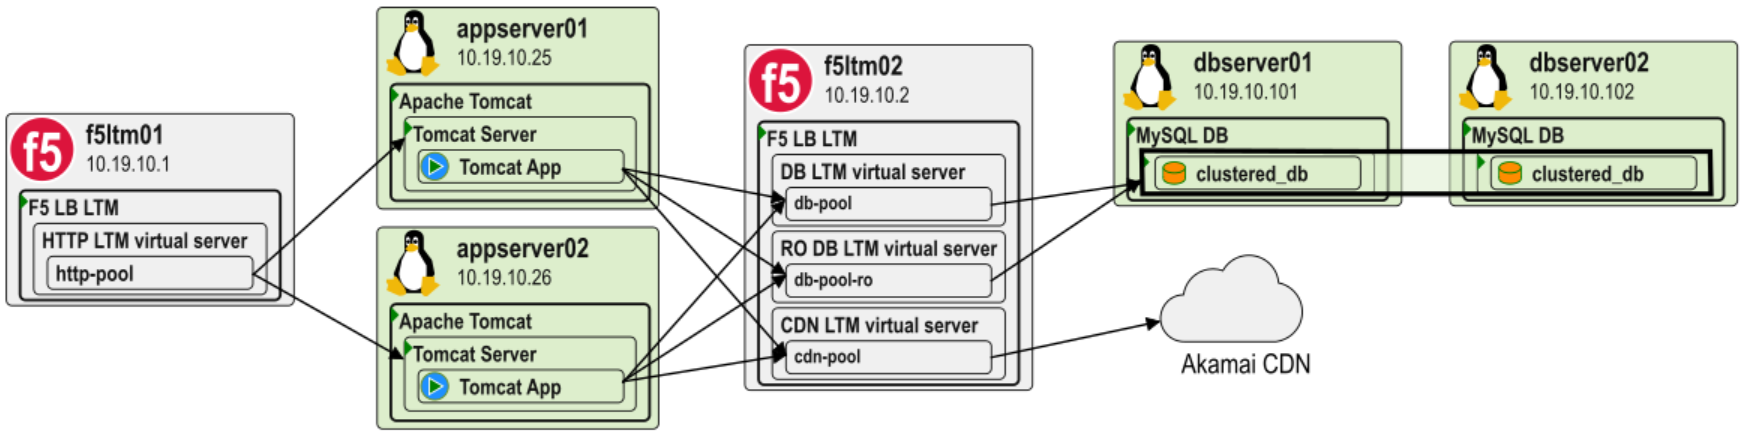
These models allow for software configuration and architecture analysis.
For example, the diagram above depicts a couple of F5 load balancers with multiple load balancing pools, Apache Tomcat Java modules, and a clustered MySQL database. For this analysis modelizeIT evaluates F5-internal language that defines F5 operation, and Tomcat and MySQL configurations as well as run-time behavior observations.
Quantity is just one of the characteristics of the modelizeIT application models.
In addition, the application models are
Reliable, time-tested, and constantly validated and updated
Deep, offering special attributes for application mapping and wave planning
(True application models and not just lists of processes running on servers.)
Broad platform coverage
Servers:
Windows 2000 and later, Hyper-V, and same generations of Windows desktop OSs.
Linux (including zLinux, Linux on ARM/Power CPUs etc.) - all major distributions.
ESX/ESXi v3 and above (32 and 64 bit)
AIX v4 and above (POWER and Intel)
HP-UX v10 and above (PA-RISC and Intel)
Solaris v8 and above (SPARC and Intel)
FreeBSD v4 and above
Tru64 (OSF1)
OSX v10 and above
OpenVMS
Mainframe zOS
Cloud services:
Importantly, our goal is the analysis of the architecture of the cloud environments and not just the collection of the trivial inventory information.
Amazon Web Services
Microsoft Azure
Google Compute Platform
Containers:
Again, the goal is the architecture and dependencies analysis and granular migration planning and not just the trivial inventory of containers, services, and pods.
Kubernetes, OpenShift, AKS, and other Kubernetes-based environments
Standalone Docker, LXR
Solaris Zones
Flexible data collection process
We rely on the specialized data collection mechanisms that allow us to
minimize CPU, memory, and network overheads, avoid interference with production workloads,
avoid the deployment of new data collection tools by integrating with existing 3rd party tools - using your existing tooling, all discovery can happen without providing our tooling with any sensitive credentials or network access
discover "shadow"/unknown servers even without the unreliable network scans by analyzing the virtualization layers
avoid the need to use middleware-level credentials in most cases.
This last requirement is what allows modelizeIT to collect deep application data in short time-frames in real life - not just for long-term deployments or demos.
Flexible architecture
modelizeIT analysis server (the analysis UI, aka RejuvenApptor™) is offered as a SaaS in multiple locations around the globe.
Clients can also choose to deploy the analysis server themselves on an on-prem server or in the cloud keeping all the collected data under their control.
The most sensitive clients can air-gap modelizeIT installations.
Application architecture diagrams
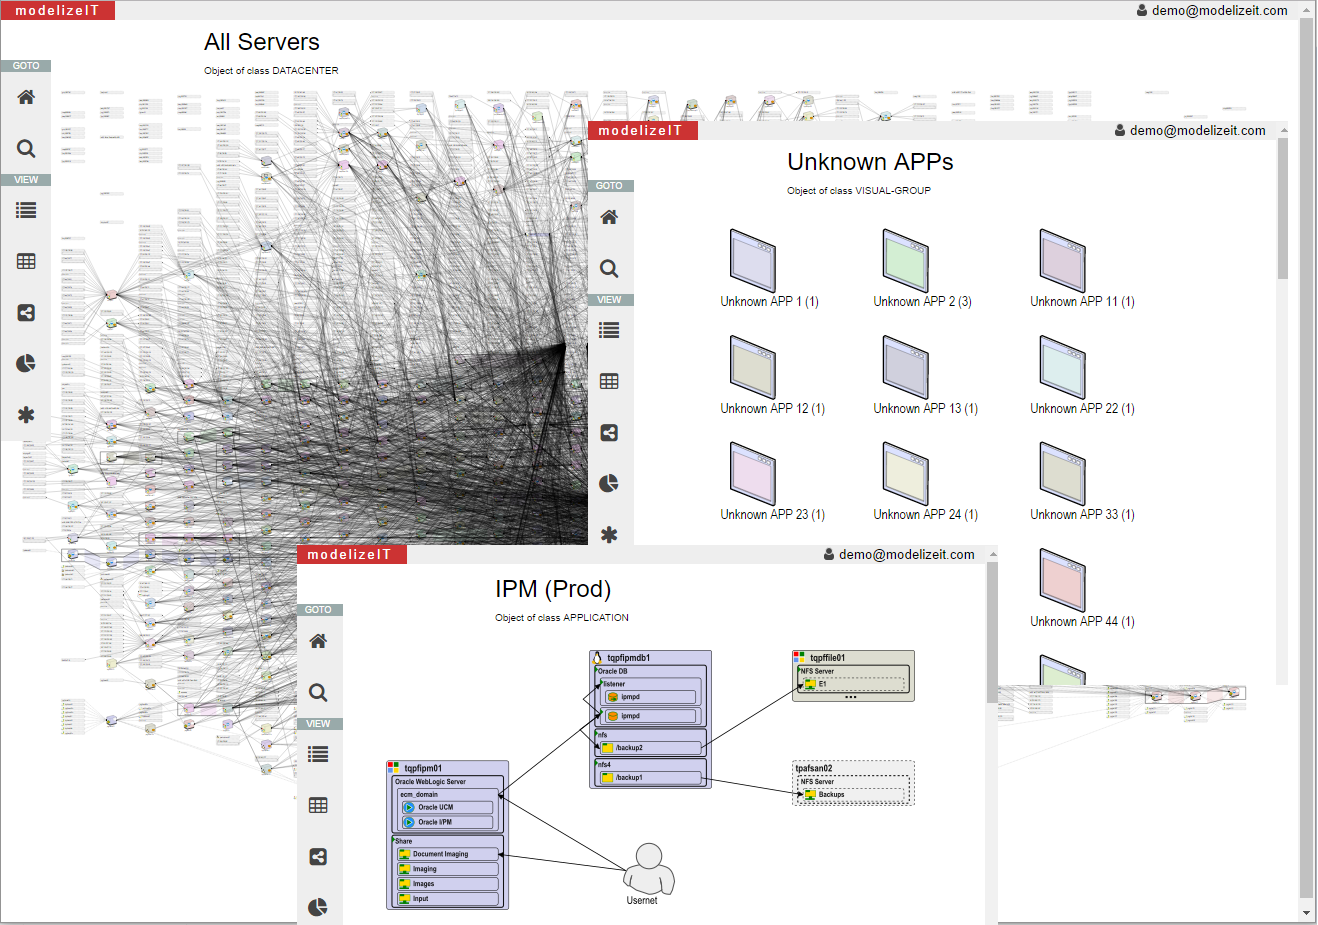
Thanks to the application models, the modelizeIT system knows about the semantics of dependencies, deep middleware objects such as databases, messaging queues, application modules, etc. as well as various clusters.This allows the modelizeIT UI to generate diagrams at various levels of details and filtering.
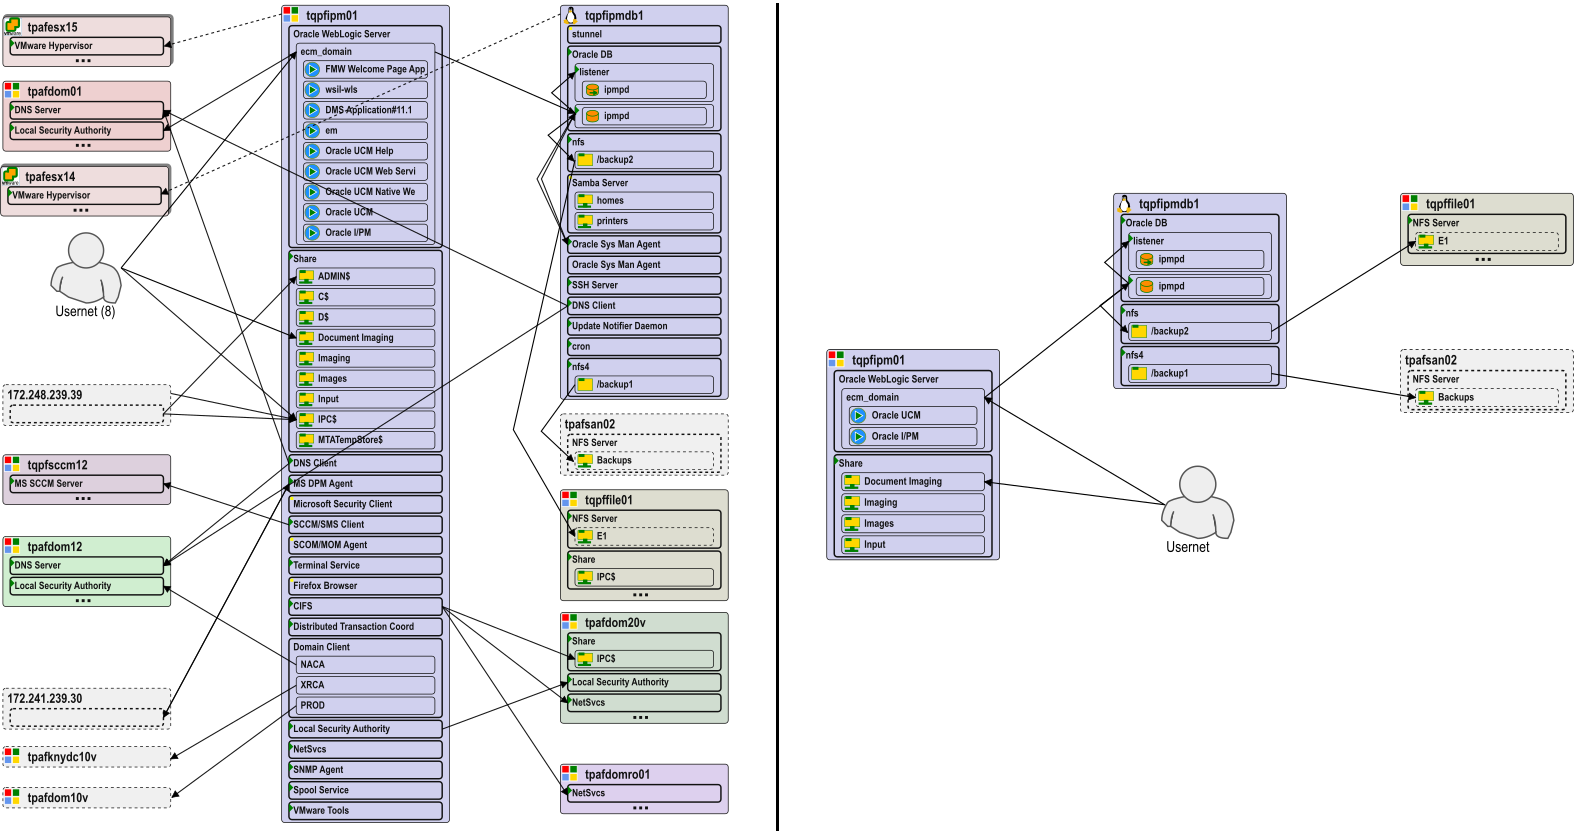
Detailed architecture diagrams are instrumental for migration architects, for facilitating client-partner discussions, and to impress clients. For example, see the differences between dependency diagrams with and without infrastructure components below.
Business application identification
Enterprise migrations are about moving business applications - not servers.Client CMDB systems have mistakes and gaps when it comes to the mapping of servers, databases, other IT resources and business applications.
This mapping is critical for the operations teams and its low quality is a common blocker for migration projects
Clients with significant knowledge gaps in their CMDBs may have to spend years waiting for the application mapping projects to complete before the real migrations can begin.
modelizeIT has unique algorithms based on its numerous application models to help identify business applications.
This algorithmic application mapping was shown to accelerate application mapping projects 10x even when compared to the use of specialized CMDB-vendor-provided application mapping tools.
Knowledge-based affinity grouping
Enterprise migrations are about migrating business applications - not servers.Applications have inter-dependencies. In fact, all or almost all applications in the enterprise IT environments are connected via infrastructure.
Based on the application models, modelizeIT knows which dependencies are okey to interrupt during the migrations and which are critical making it desirable to migrate connected applications together. This eliminates a lot of manual labor and guessing that tools without a large number of application models (or working at the server level and not application level at all) have to make resulting in unpredicted outages and increased delays and costs for migrations.
Another common problem for affinity grouping is highly shared servers.
One shared application server or database server may host several, dozens, or more applications.
Each application would have its own dependencies resulting in servers connected to a large fraction of the servers.
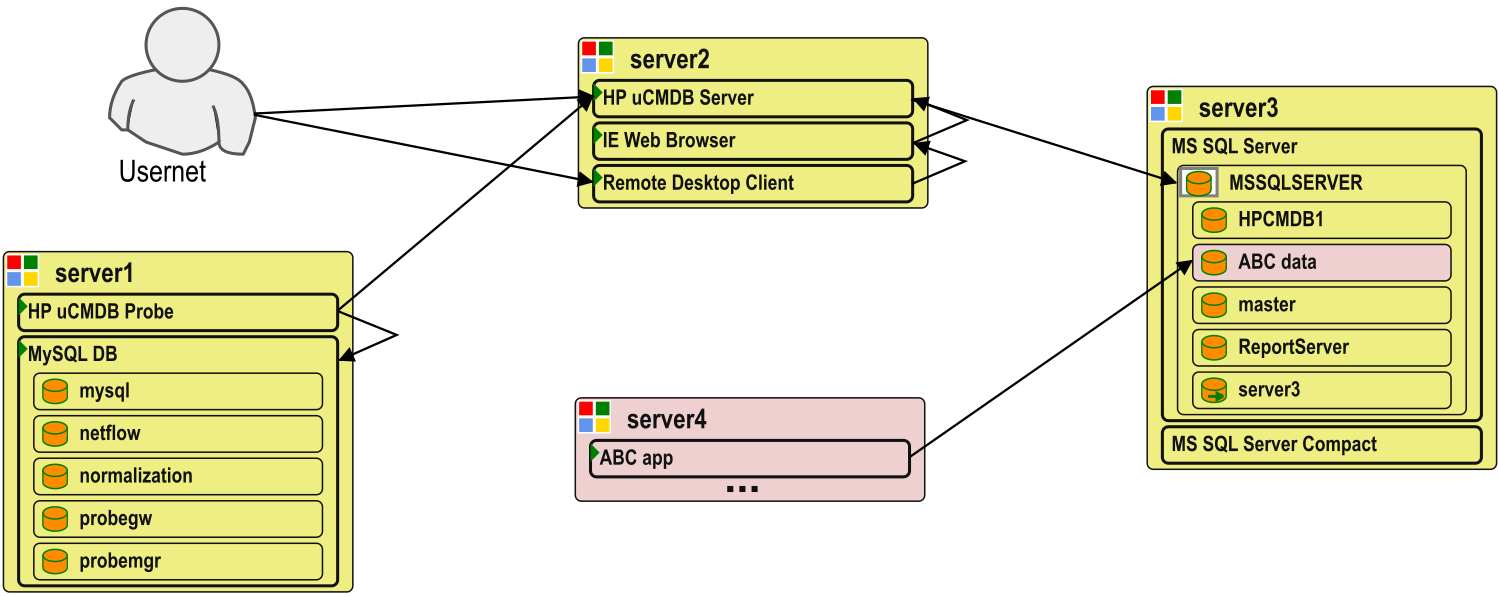
Thanks to modelizeIT's component-based analysis it makes it possible to separate individual application instances on shared servers and plan affinity groups based on individual business applications.
Server-level planning tools or tools with only a few application models would have limited or no capabilities to deal with this common problem.
A simple example SQL server instance (MSSQLSERVER) shared by just two applications is shown below.
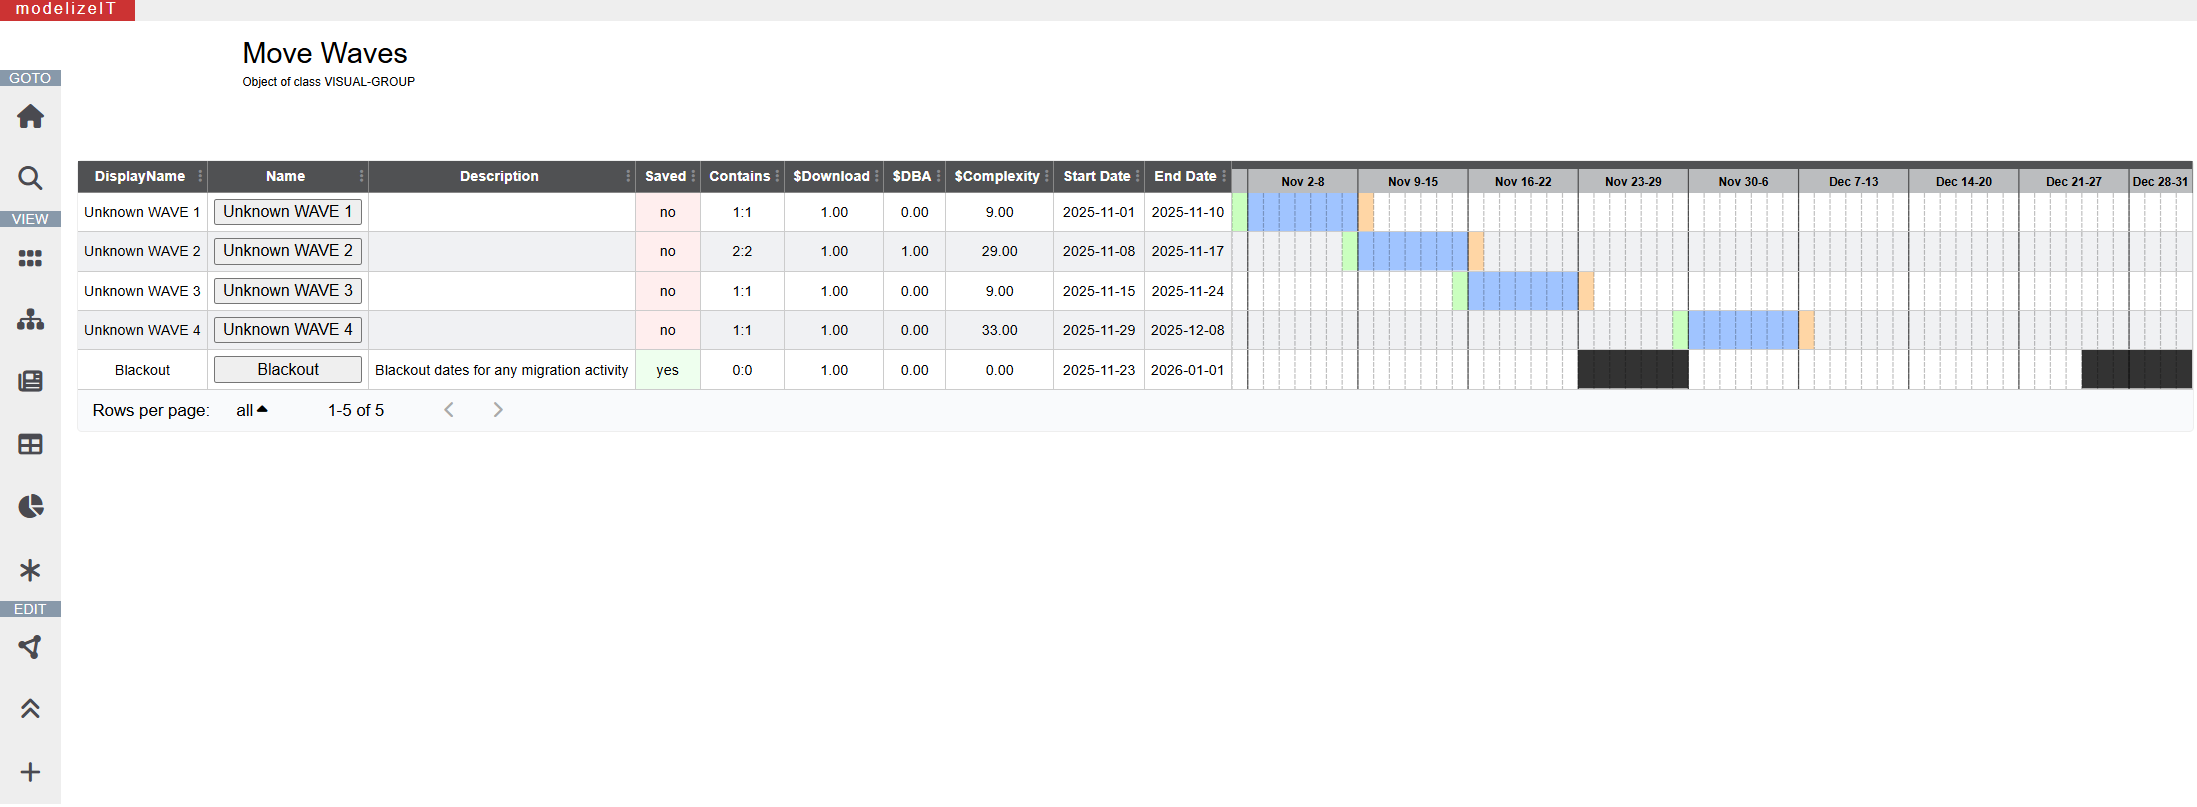
Wave planning based on deep technical details
modelizeIT has a highly-customizable Rule-based Wave planning engine.Traditional wave planning systems rely on the business application attributes and limited or no application configuration data. modelizeIT wave planning rules can rely on both: business context and deep technical data.
For example, one can specify a deadline for migration of all instances of a specific software product due to the related license expiration or can define rules to estimate complexity of work for DBAs based on specific attributes of database configurations.
This flexibility reduces manual labor necessary for wave planning and makes wave planning process repeatable for the migration service providers.
Non-trivial capacity planning for accurate cost estimates
modelizeIT captures server-based and application-instance-based resource usage metrics over time.This includes CPU, paging/swap, RAM, storage and networking I/O.
For the client-side view of the storage utilization modelizeIT captures per-NFS-mountpoint metrics like latency, number of read and write requests and data volume.
To avoid calculating the costs of the same storage multiple times modelizeIT uses its models to analyze storage clusters.
For these with most aggressive cost cutting and capacity planning goals modelizeIT captures active vs cold memory usage on Linux.
Similarly, modelizeIT captures clustering information so the stand-by and DR servers can be identified and provisioned for the much higher capacity than utilization observation may suggest.
These and other application-centric analysis measures make capacity and cost estimates based on modelizeIT data a lot more accurate than non-application-centric analysis can provide.
Different types of workloads have different characteristics and resource bounds be it databases, file servers, Hadoop, SAP, etc. modelizeIT performs capacity planning and adjusts its selection of benchmarks based on the type of applications running on the server. This functionality is impossible for the server-data-based migration planning tools.
modelizeIT can also understand the configuration of non-trivial non-Intel-based virtualization such as for IBM Power or SPARC-based systems where multiple VMs can share the same large CPU pools with various weights.
This allows modelizeIT to plan migrations from Unix and non-Intel/AMD-based CPUs to Linux on cloud CPUs (Intel, AMD, ARM/Graviton).
Licensing analysis
modelizeIT detects thousands of software products and has deep licensing analysis capabilities for 160+ Microsoft and 180+ Oracle products.Oracle licensing is at least an order of magnitude more complex than Microsoft analysis.
modelizeIT Oracle licensing analysis is so accurate that top-tier Oracle partners use modelizeIT to help clients prepare for the actual Oracle audits.
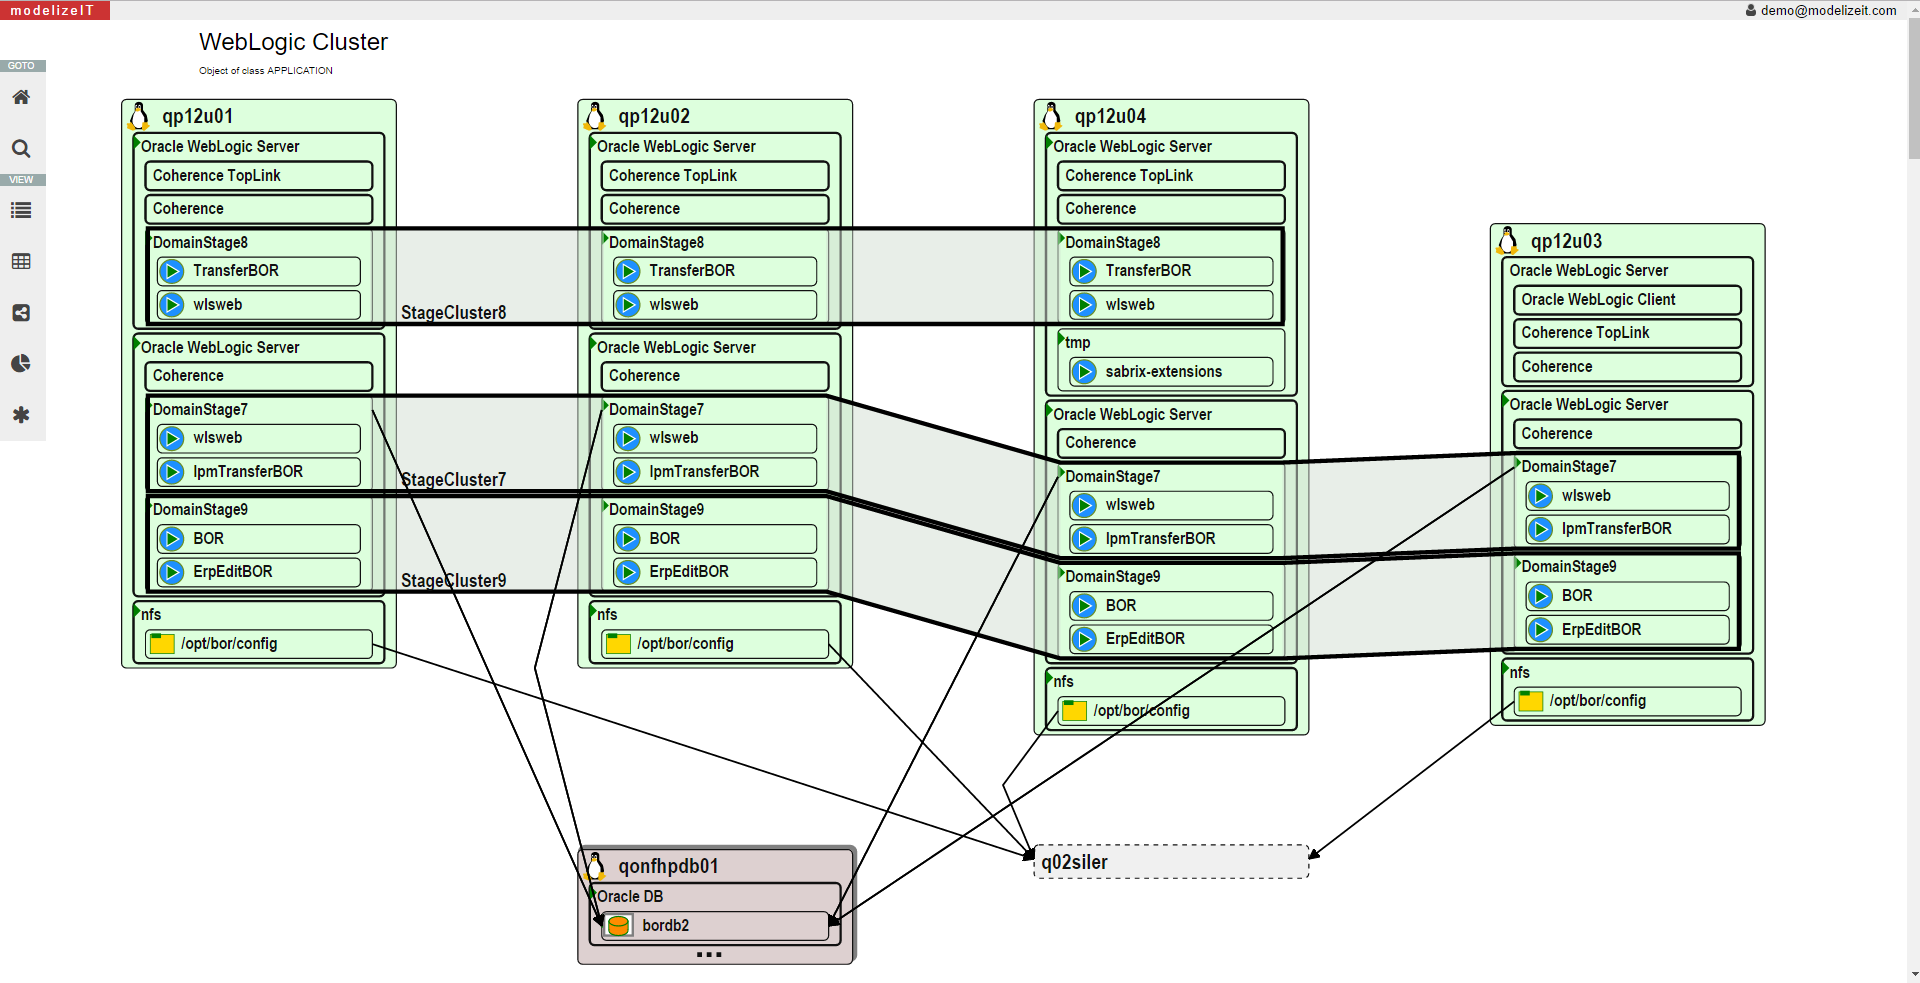
Modernization of shared servers
To better leverage the benefits of the cloud modern migrations may require changes to the architecture of the applications.This often involves splitting shared servers: some instances may become individual servers, containers, PaaS services, etc.
modelizeIT captures resource utilization and depenencies at the software instance level or deeper, meaning each instance can be considered and planned for independently. Migration planning tools that rely on server level data or do not analyze as many applications would not be able to plan this transformation.
Below is a diagram of an asymmetrical Oracle WebLogic cluster used by multiple applications with each Domain shown as a separate cluster.
Modernization of software stacks
modelizeIT can detect a wide variety of software stacks on the servers and can be used to decide which software configurations should be considered for modernization.A classical example is the replacement of IIS-based .NET applications with Linux-based deployments.
Such software-specific modernization activities can be performed by software-focused tools designed for a migration of a specific software stack. However, such specialized tools first always require a broad software stack scan that can be done by modelizeIT.
Retire
modelizeIT has algorithms to detect unused servers and groups of servers.Read technical details in our research paper published at USENIX CoolDC'16:
Security zones
modelizeIT has a patented functionality to plan security zones (US patent US20150261887A1).Clients perform security zones planning as part of migration planning or as part of their micro-segmentation projects to improve security.